
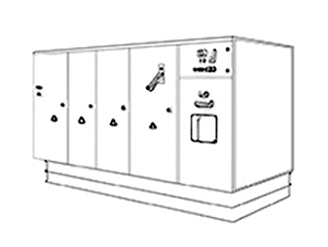
The wind power converter uses the rotor of the doubly-fed asynchronous wind generator to excite, which makes the amplitude, frequency and phase of the stator side output voltage of the doubly-fed generator the same as the power grid, and the active and reactive power can be independently decoupled as required. The converter controls the doubly-fed asynchronous wind generator to realize soft grid-connection and reduce the adverse impact of grid-connection and motor from electric current. It can be said that whether the wind power converter runs stably directly affects the stability of the power grid. How to ensure the normal operation of wind power converter, heat dissipation is an indispensable step.
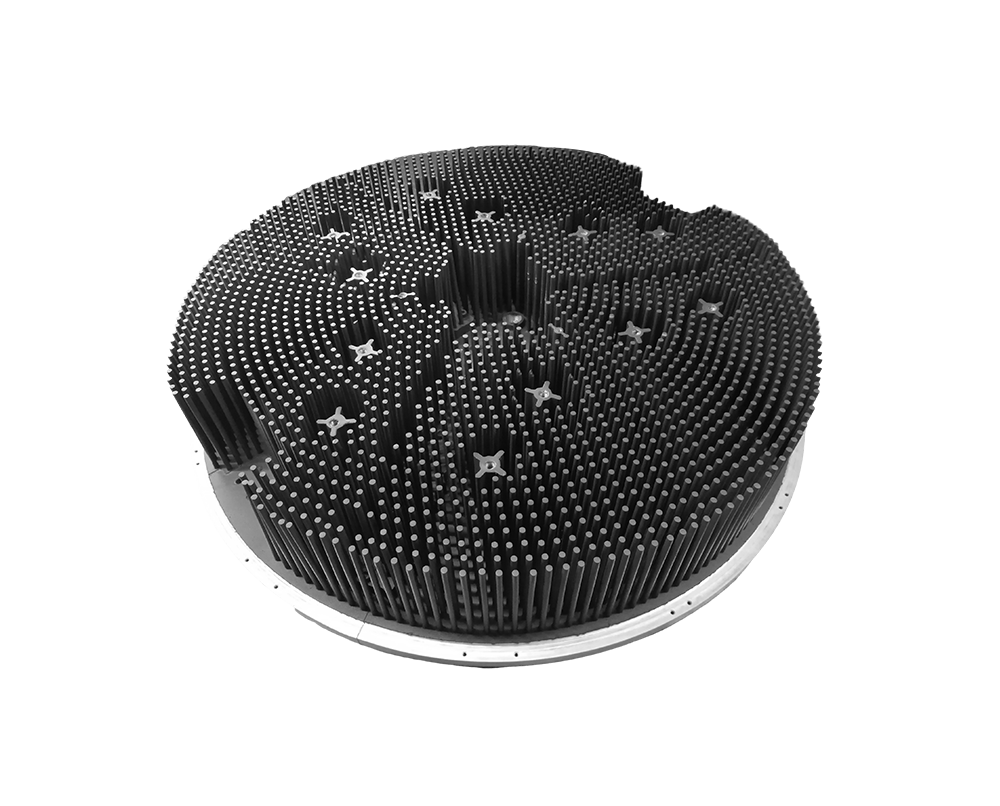
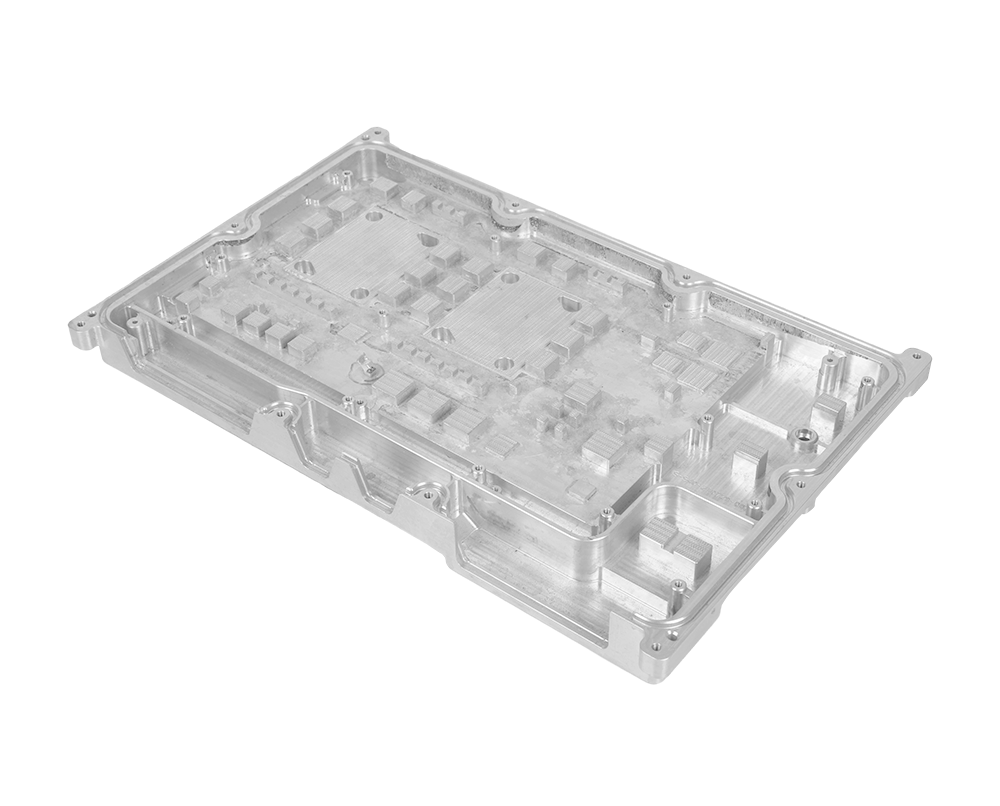
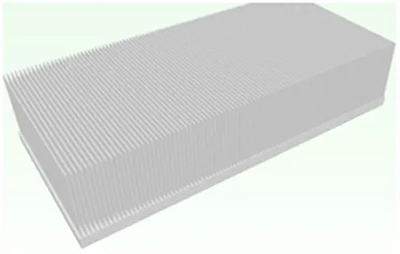
Substrate size: 462*220*15mm;
Fin thickness: 1.5mm;
Fin qty: 92fins;
Fin height: 87mm;
Material: AL1060;
Process: Skived;
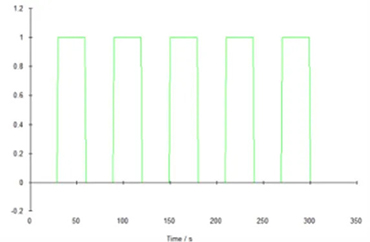
Runs for 16cycles, atotal of 960s.
0-29s: 0%;
29s-30s: from 0% to 100%;
30s-59s: 100%;
59s-60s: from 100% to 0%;
Run 60s circularlyata cycle.
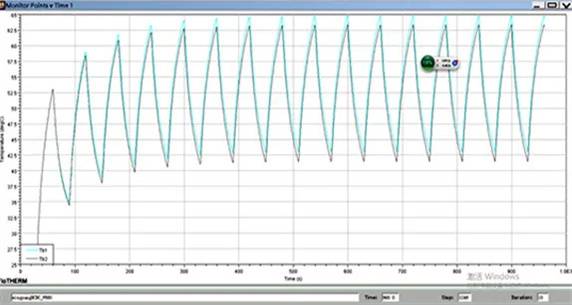
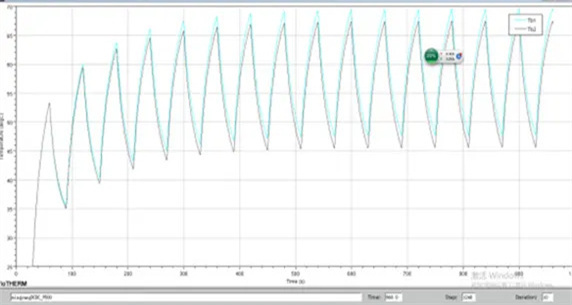
The diagram of Tb temperature over time: ( airflow:500m^3/H)
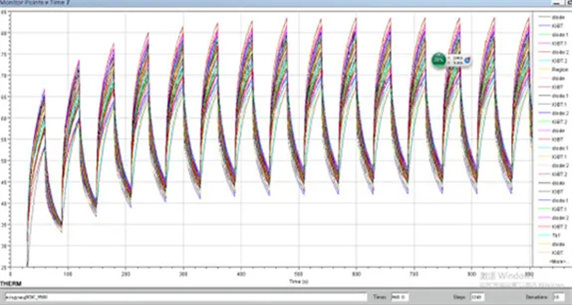
The change diagram of surface temperature over time of IGBT core components
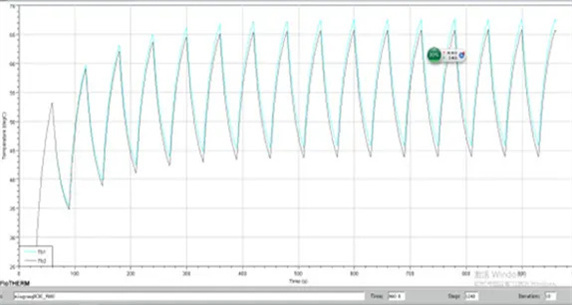
The diagram of Tb temperature over time: ( airflow:600m^3/H)
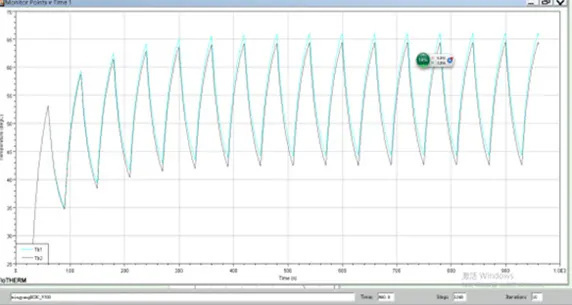
The diagram of Tb temperature over time: ( airflow:700m^3/H)
The diagram of Tb temperature over time: ( airflow:800m^3/H)
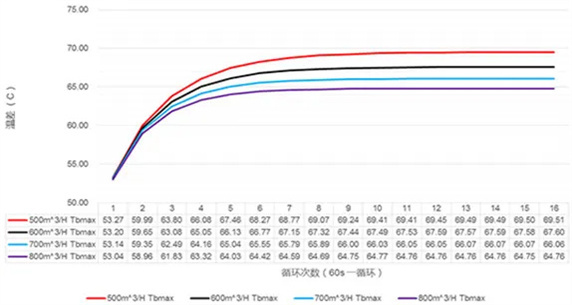
The time cycling variation simulation results of highest surface temperature of heat source bottom radiator
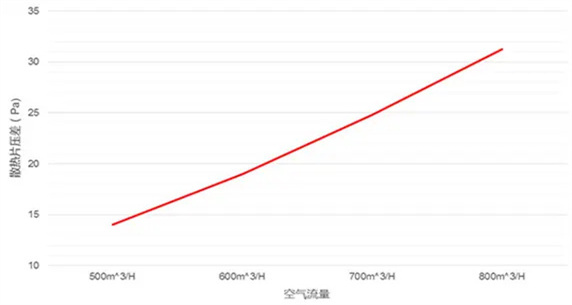
Simulation results of heat sink pressure loss and flow
 +86 18879690228
Email: Harvey@greenwayalu.com
Headquarters: Floor 5, Building B,GS Industry Park, Longhua District, Shenzhen518109,China.
Dongguan factory: Shishuikou Industrial Park, Qiaotou Town, Dongguan City, Guangdong Province,China.
©2013 GREENWAY All rights reserved


 CN
CN Home >